|
|
|
|
| Interpretation
(GRB): In the works: If you would like to submit an interpretation of this graph, contact Trudy.
|
| About the trend lines: |
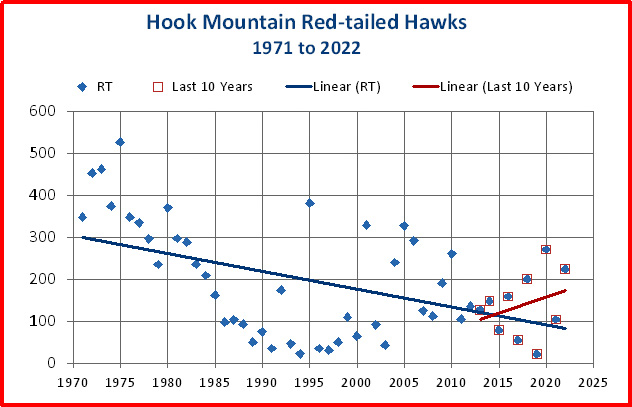
The trend lines have not been tested for significance. Their intent is to provide an overview of the general trend. The graphs show two trend lines: 1971 - present, and the last 10 years. The Hook Mountain Hawk Watch began in 1971, and the points with blue markers indicate the totals for all these years. The points that show red squares around the blue markers represent the last ten years, showing the trend in this last decade. The dashed green line shows the average for all years. more about trend lines . . . . |


