|
|
|
interpretation other species about the trend lines seasonal distribution |
|
|
| Interpretation
(GRB):
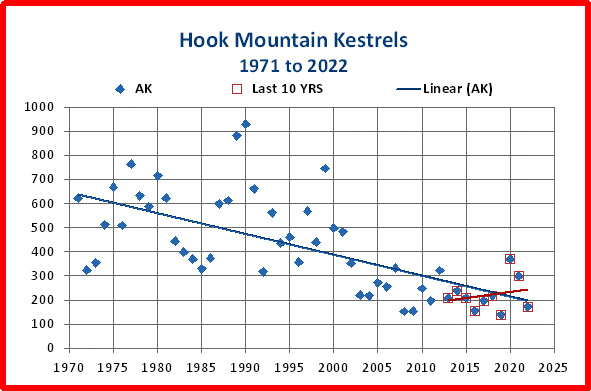
Cause for Concern: The number of Kestrels counted at Hook has shown considerable variation, but has generally been declining since 1971. During the last 10 years, the trend has leveled off, declining less. Closer examination of the graph shows periods with sharp declines and sharp increases, suggesting that we should not be too concerned about an occasional low number of Kestrels. However, the Kestrel counts for the last 11 years have been the lowest counts in the history of Hook, with 2019 the lowest of all. Hopefully, Kestrel counts will not decline further. Better yet, we hope for a recovery in the years ahead. |
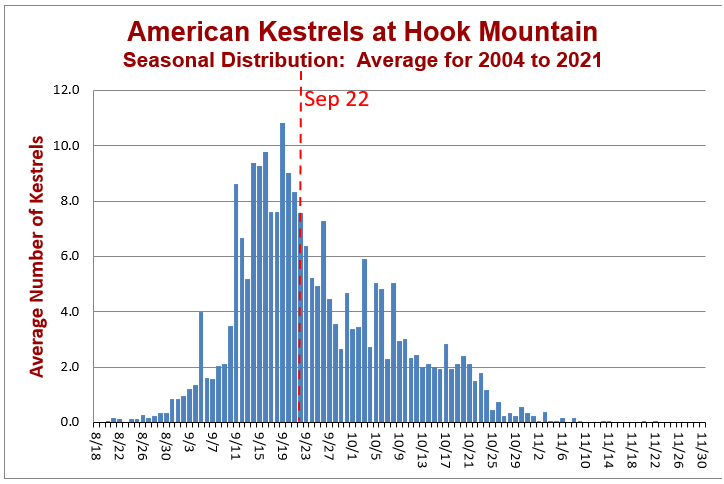
Seasonal Distribution |
 |
| About the trend lines: |
The intent of the trend lines is to provide an overview of the general trend. The graphs show two trend lines: 1971 - present, and the last 10 years. The Hook Mountain Hawk Watch began in 1971, and the points with blue markers indicate the totals for all these years. The points that show red squares around the blue markers represent the last ten years, showing the trend in this last decade. The "Since 1971" trend line in blue was tested for significance. Equations in bold are statistically significant. The "Last 10 Year" trend was not tested for significance. more about trend lines . . . . |

